음성 데이터 (오디오 파일 이해, 2D Sound Waves, Fourier Transform, Spectrogram)
2021. 4. 3. 00:30ㆍ민공지능/음성 인식 프로젝트
동일한 조건 속에서 혼성 목소리를 분석하기 위해
'실내 사람 간 2m 이상 거리 두기. 거리두기 지침에 따라 이 자리는 비워주세요.'라는 문장을 각각 5초씩 녹음했다.
(환경소음은 동일하지 않다)
오디오 파일 이해하기
- y: 소리가 떨리는 세기(진폭)를 시간 순서대로 나열한 것
- Sampling rate: 1초당 샘플의 개수, 단위 Hz 또는 kHz
import librosa
import numpy as np

y1, sr1 = librosa.load('C:/nmb/nmb_data/we/testvoice_F1_high.wav')
y2, sr2 = librosa.load('C:/nmb/nmb_data/we/testvoice_F1.wav')
y3, sr3 = librosa.load('C:/nmb/nmb_data/we/testvoice_F2.wav')
y4, sr4 = librosa.load('C:/nmb/nmb_data/we/testvoice_F3.wav')
y5, sr5 = librosa.load('C:/nmb/nmb_data/we/testvoice_M1.wav')
y6, sr6 = librosa.load('C:/nmb/nmb_data/we/testvoice_M2.wav')
y7, sr7 = librosa.load('C:/nmb/nmb_data/we/testvoice_M2_low.wav')


name = ['F1_high','F1', 'F2','F3','M1','M2','M2_low']
y_list = [y1, y2, y3, y4, y5, y6, y7]
sr_list = [sr1, sr2, sr3, sr4, sr5, sr6, sr7]

for i in range(7):
    print('name : ',name[i])
    print('y : ', y_list[i])
    print('y_shape: ', np.shape(y_list[i]))
    print('Sampling rate (KHz): %d' % sr_list[i])
    print('Audio length (seconds): %.2f' % (len(y_list[i]) / sr_list[i]))
    print("---------------------------------------------------------------")
name : F1_high
y : [ 0.00192407 0.0018763 -0.00786052 ... 0.00626361 0.00471488
0.00340034]
y_shape: (110250,)
Sampling rate (KHz): 22050
Audio length (seconds): 5.00
---------------------------------------------------------------
name : F1
y : [-0.00791849 -0.01604515 -0.01919263 ... -0.00742689 -0.00921659
-0.01277701]
y_shape: (110250,)
Sampling rate (KHz): 22050
Audio length (seconds): 5.00
---------------------------------------------------------------
name : F2
y : [-2.9244100e-05 -7.4235257e-05 -9.4395844e-05 ... 6.2298583e-04
-1.2165480e-03 -4.3098307e-03]
y_shape: (110250,)
Sampling rate (KHz): 22050
Audio length (seconds): 5.00
---------------------------------------------------------------
name : F3
y : [-4.7423411e-04 -7.9243019e-04 -7.6184463e-04 ... -2.1376862e-05
-1.3720954e-03 -4.7669141e-03]
y_shape: (110250,)
Sampling rate (KHz): 22050
Audio length (seconds): 5.00
---------------------------------------------------------------
name : M1
y : [ 0.00193886 0.00318138 0.00280431 ... -0.00544097 -0.00411864
-0.00283034]
y_shape: (110250,)
Sampling rate (KHz): 22050
Audio length (seconds): 5.00
---------------------------------------------------------------
name : M2
y : [-0.00059613 -0.00085017 -0.00061753 ... -0.01141425 -0.01117867
-0.01249205]
y_shape: (110250,)
Sampling rate (KHz): 22050
Audio length (seconds): 5.00
---------------------------------------------------------------
name : M2_low
y : [-0.00033247 -0.00050568 -0.00041328 ... 0.01148276 0.00852127
0.00754578]
y_shape: (110250,)
Sampling rate (KHz): 22050
Audio length (seconds): 5.00
---------------------------------------------------------------
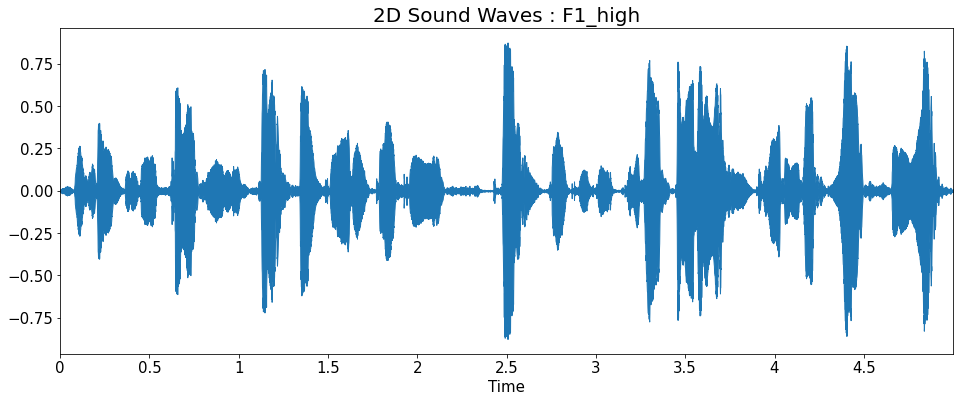
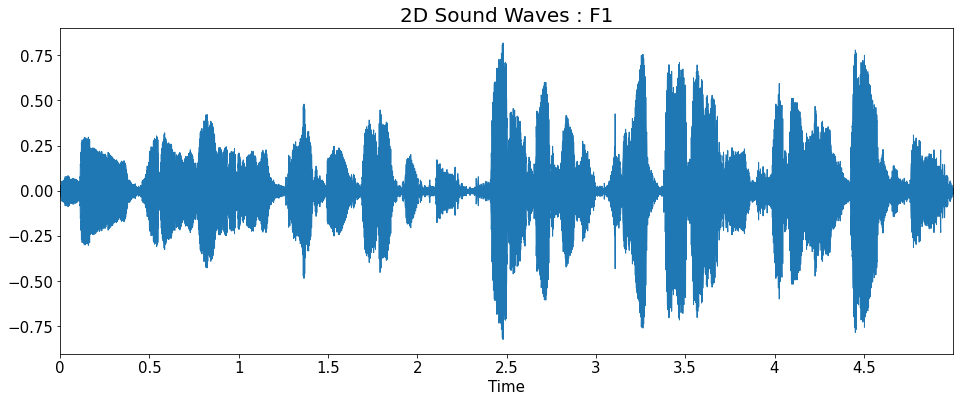
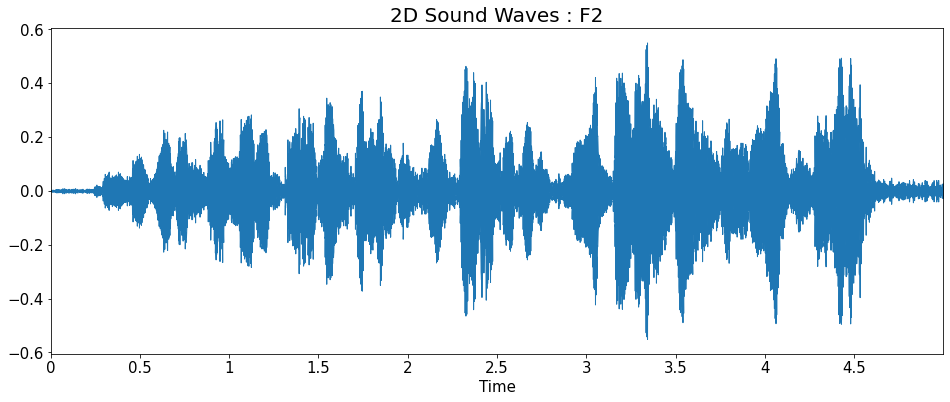
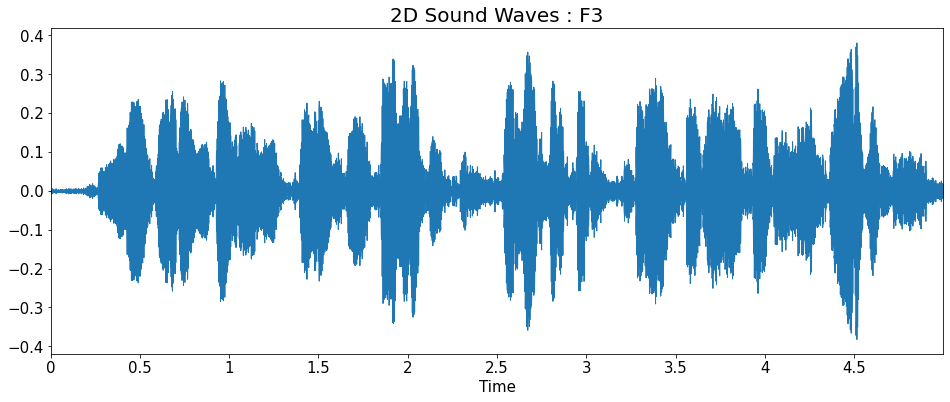
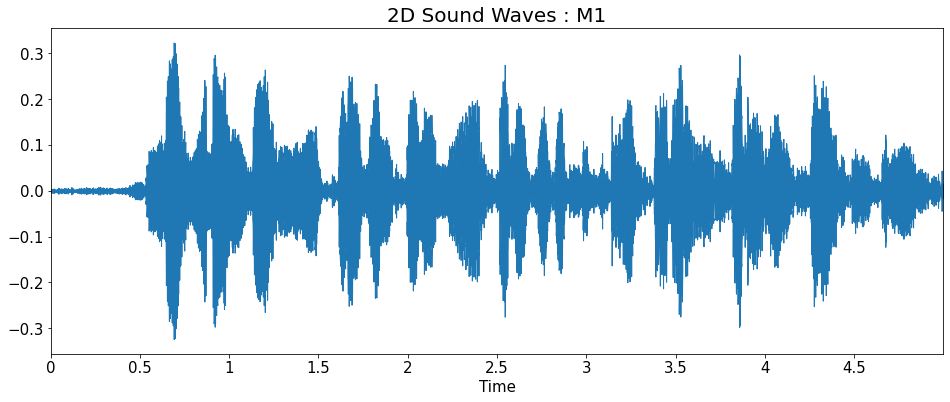
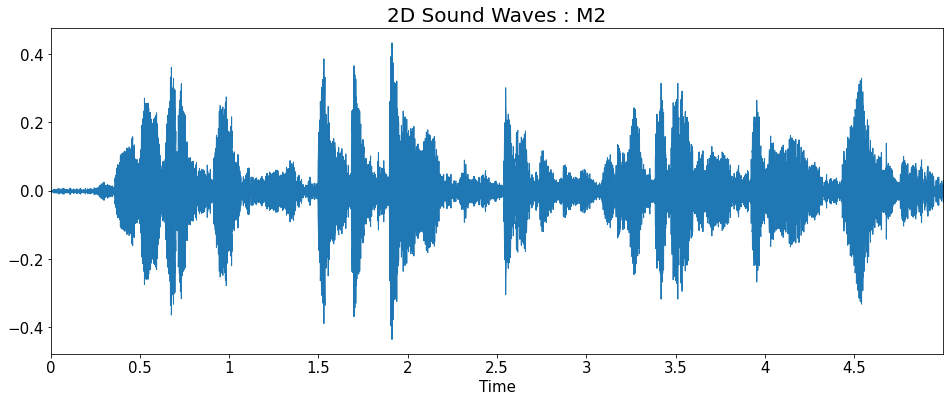
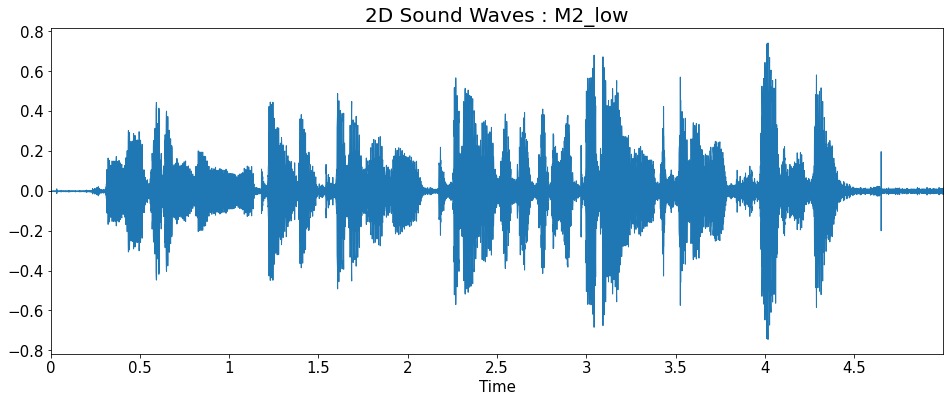
2D Sound Waves
import matplotlib.pyplot as plt
import librosa.display

title = ['2D Sound Waves : F1_high','2D Sound Waves : F1',
        '2D Sound Waves : F2','2D Sound Waves : F3','2D Sound Waves : M1',
        '2D Sound Waves : M2','2D Sound Waves : M2_low']

for i in range(7):
    plt.figure(figsize=(16, 6))
    librosa.display.waveplot(y=y_list[i], sr=sr_list[i])
    plt.title(title[i], fontsize=20)
    plt.show()
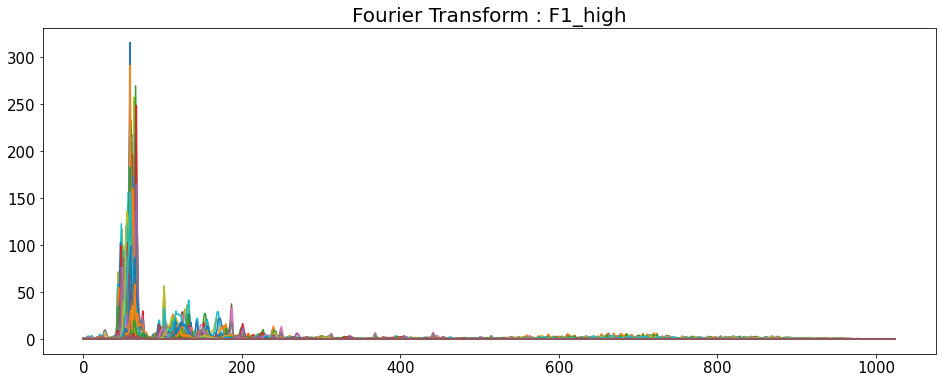
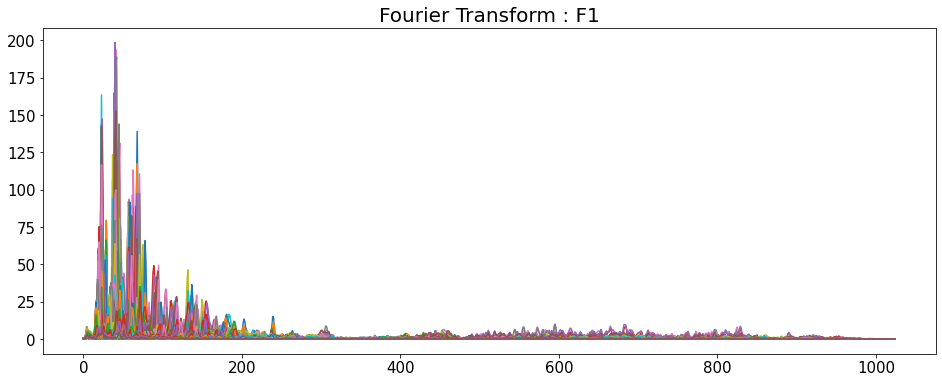
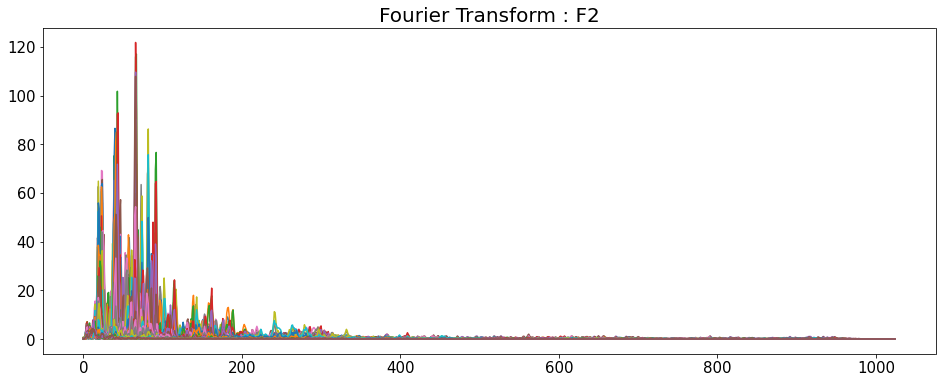
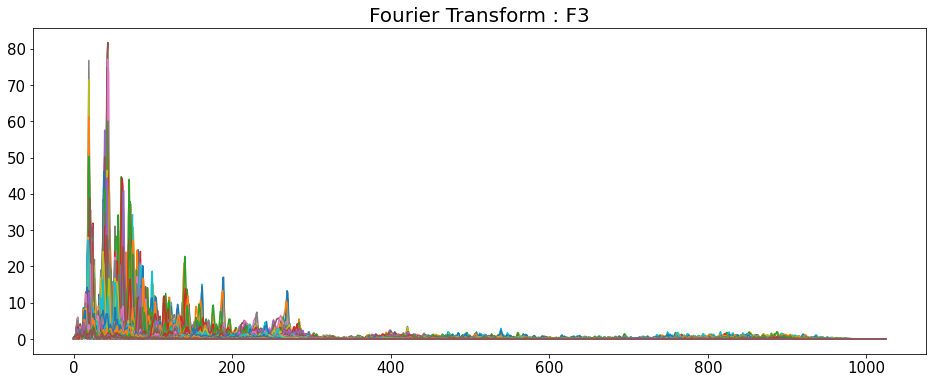
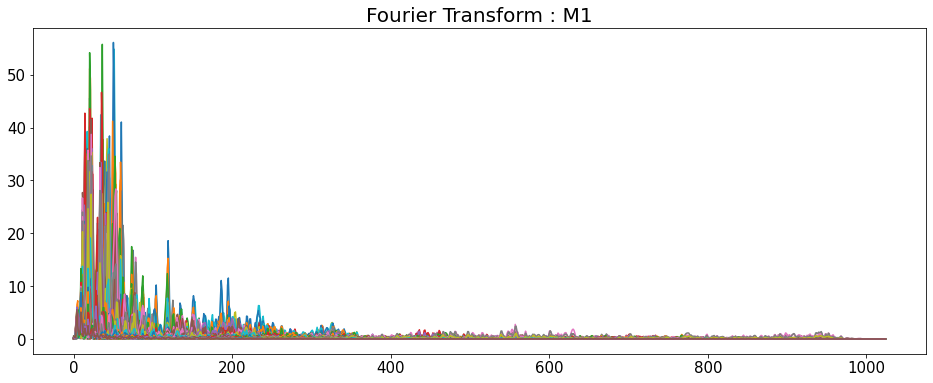
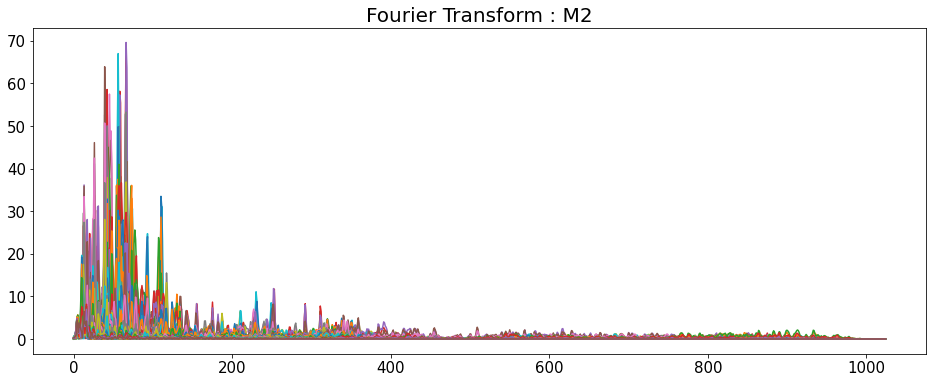
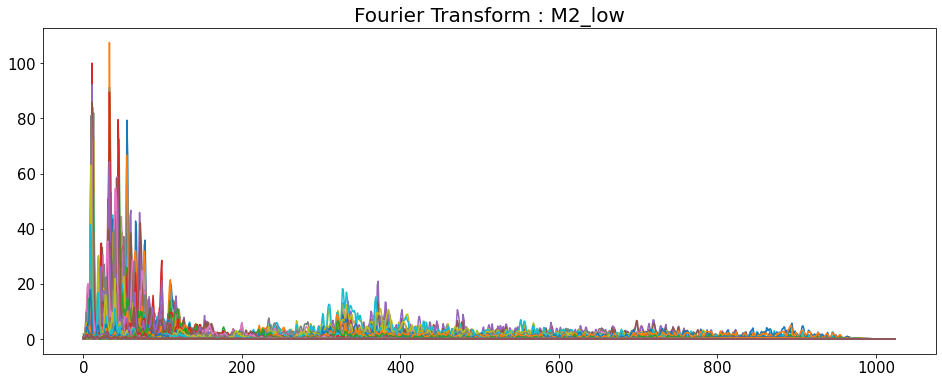
Fourier Transform
- 시간 영역 데이터를 주파수 영역으로 변경
- y축: 주파수 (로그 스케일)
- color 축: 데시벨 (진폭)
import numpy as np

title = ['Fourier Transform : F1_high','Fourier Transform : F1',
        'Fourier Transform : F2','Fourier Transform : F3','Fourier Transform : M1',
        'Fourier Transform : M2','Fourier Transform : M2_low']

for i in range(7):
    D = np.abs(librosa.stft(y_list[i], n_fft=2048, hop_length=512))
    # np.abs = 절대값을 반환
    print('D_shape : ',D.shape)

    plt.figure(figsize=(16,6))
    plt.title(title[i], fontsize=20)
    plt.plot(D)
    plt.show()
D = default
shape은 모두 (1025,216)이다.
D_shape : (1025, 216)
D_shape : (1025, 216)
D_shape : (1025, 216)
D_shape : (1025, 216)
D_shape : (1025, 216)
D_shape : (1025, 216)
D_shape : (1025, 216)
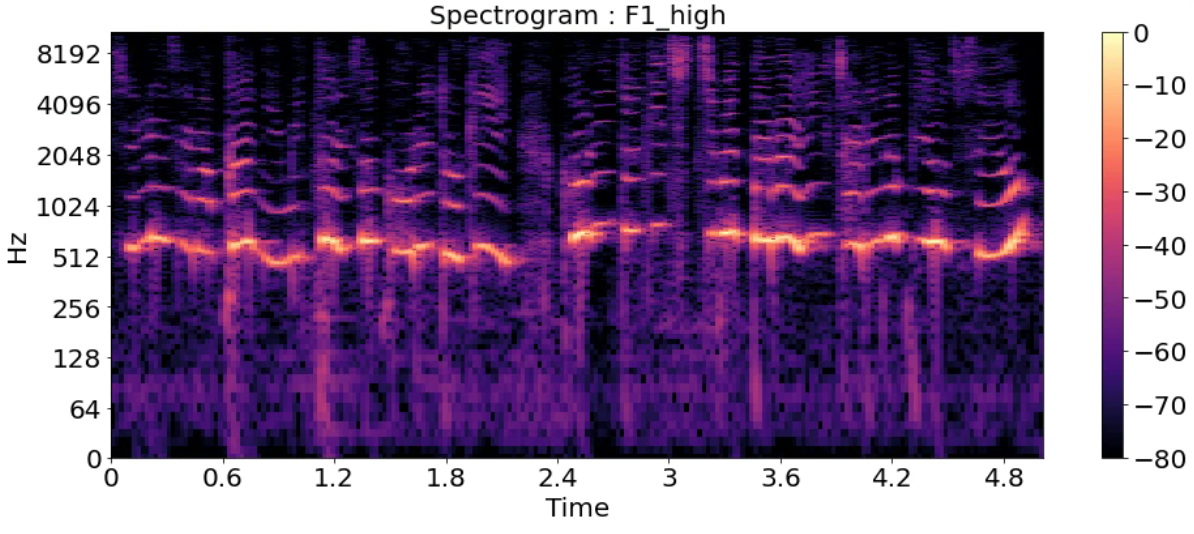
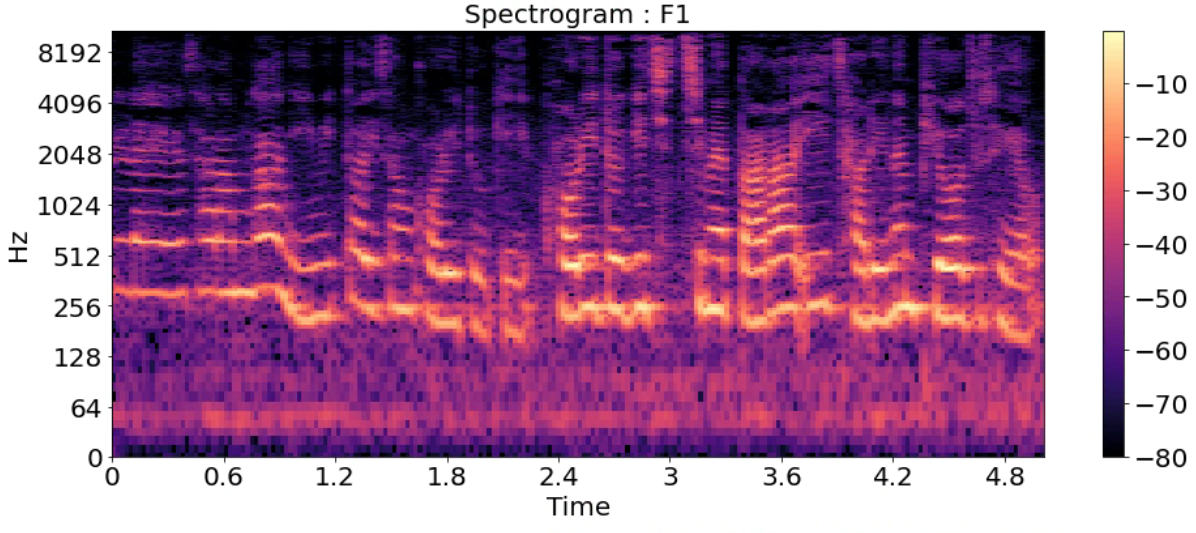
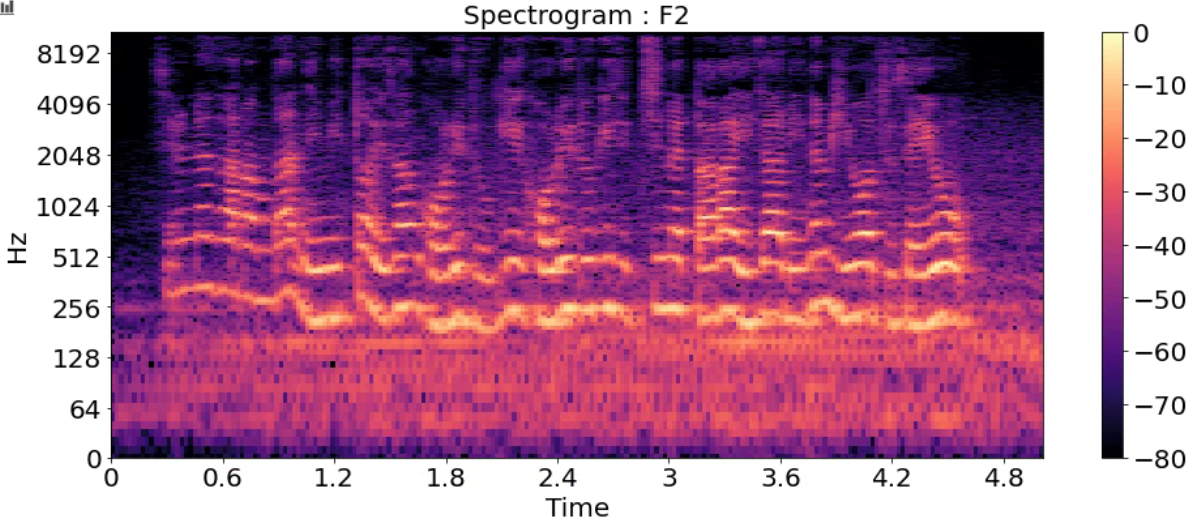
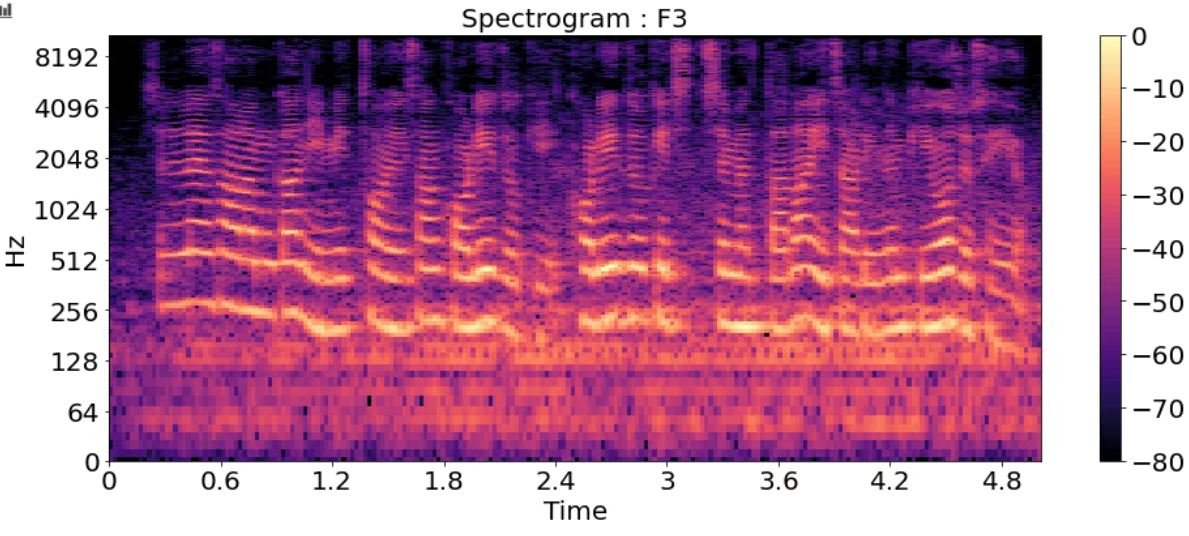
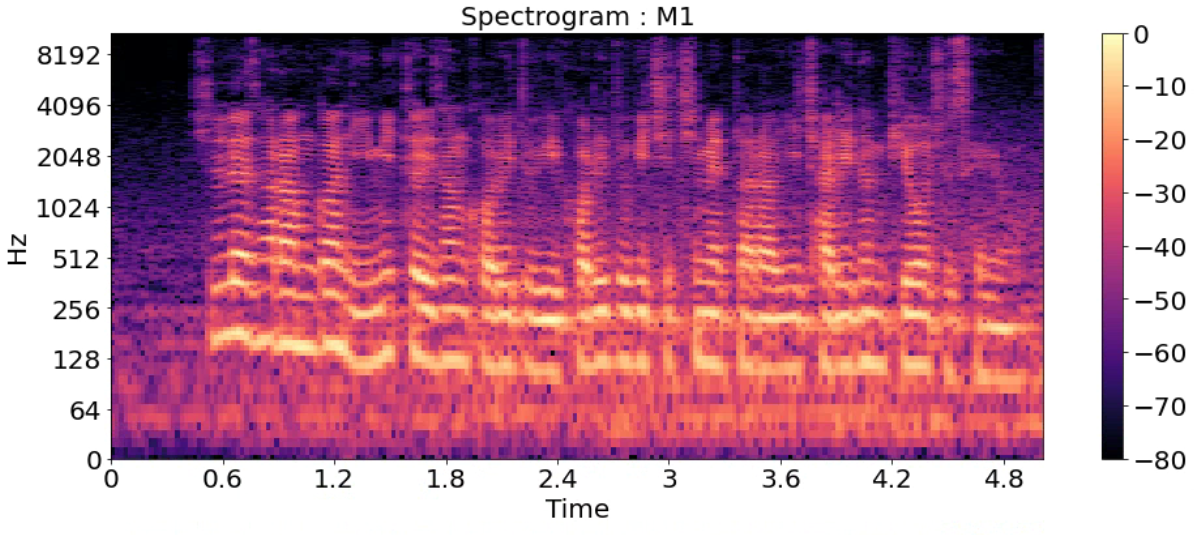
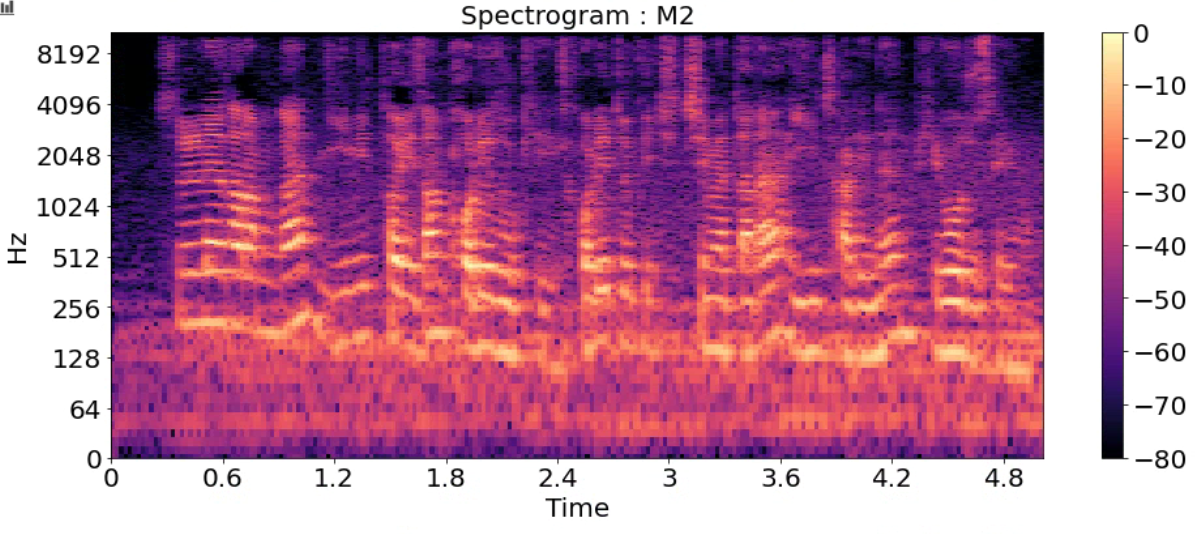
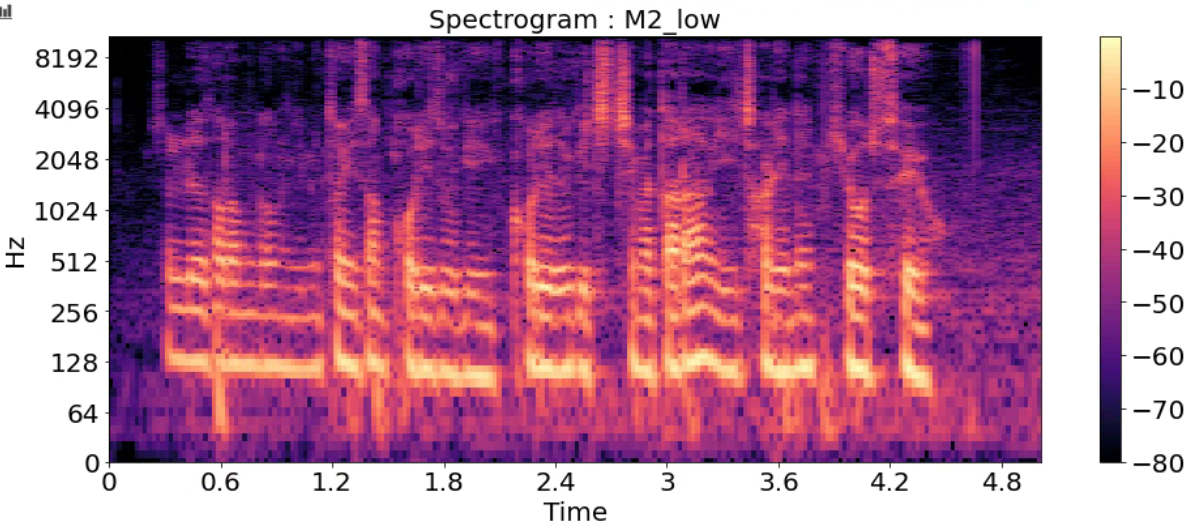
Spectrogram
- 시간에 따른 신호 주파수의 스펙트럼 그래프
- 다른 이름: Sonographs, Voiceprints, Voicegrams
title = ['Spectrogram : F1_high','Spectrogram : F1',
        'Spectrogram : F2','Spectrogram : F3','Spectrogram : M1',
        'Spectrogram : M2','Spectrogram : M2_low']

for i in range(7):
    D = np.abs(librosa.stft(y_list[i], n_fft=2048, hop_length=512))
    DB = librosa.amplitude_to_db(D, ref=np.max)

    plt.figure(figsize=(16, 6))
    librosa.display.specshow(DB, sr=sr_list[i], hop_length=512, x_axis='time', y_axis='log')
    plt.title(title[i], fontsize=20)
    plt.colorbar()
    plt.show()
'민공지능 > 음성 인식 프로젝트' 카테고리의 다른 글
| STT (0) | 2021.04.26 |
|---|---|
| Speech VGG (0) | 2021.04.25 |
| librosa.feature (0) | 2021.04.03 |
| 음성 데이터2(Mel Spectrogram, MFCCs, Chroma Frequencies) (0) | 2021.04.03 |